
Many of the developed areas of Brookhaven Hamlet are in the coastal floodplain and subject to flooding from storms such as hurricanes. Long Island has had many such storms.
The 1938 Hurricane “The Long Island Express” was the most destructive. It was a category 3 storm. The lowest pressure at the time of landfall occurred near Bellport, where a reading of 27.94 inches was recorded. Eastern Long Island and New England were hit with wind speeds that exceeded 180 mph! Downtown Westhampton Beach, a mile inland, was under 8 feet of water. Brookhaven Hamlet escaped much of the most destructive force of the of this hurricane because it was near the path of the hurricane eye; the most destructive hurricane effects are usually in the northeast (12-3 o’clock) quadrant of the storm. (A now large sycamore tree in my back yard artistically arranged at a sharp angle is reputed to have been blown so by the storm.)
Flood Insurance Rate Maps (FIRMs)
The Federal Emergency Management Agency (FEMA) issues maps which seek to identify Special Flood Hazard Areas. FEMA administers the National Flood Insurance Program.
Homeowners insurance policies do not cover flood damages. It is only available through the Federal flood insurance program. Its coverage is limited to building and personal property damages from flooding — and sets up the inevitable conflict over what is windstorm damage and what is flood/storm surge damage. Flood insurance is obtained through regular insurance agents or brokers. FloodSmart.gov provides some tools for estimating the cost of coverage.
What do FEMA Flood Maps Show?
The main difference between the FIRMs and the SLOSH maps (see left) is that the FIRM take into consideration probabilities of occurrence (that is an insurance or actuarial perspective), while the SLOSH maps assume a certainty of a worst case event (an emergency planning perspective).
Of course, the probability that a Category 3 or 4 hurricane would strike Long Island at the worst possible place for the residents of a particular place at the worst possible time is small (but not zero, as history shows). The probability of one that has the perfect track and is going at the perfect speed (slowly) to cause a maximum storm surge is very small. These low probabilities enables insurance rates, which spread the loss risk over a large population, to be relatively small compared to value protected.
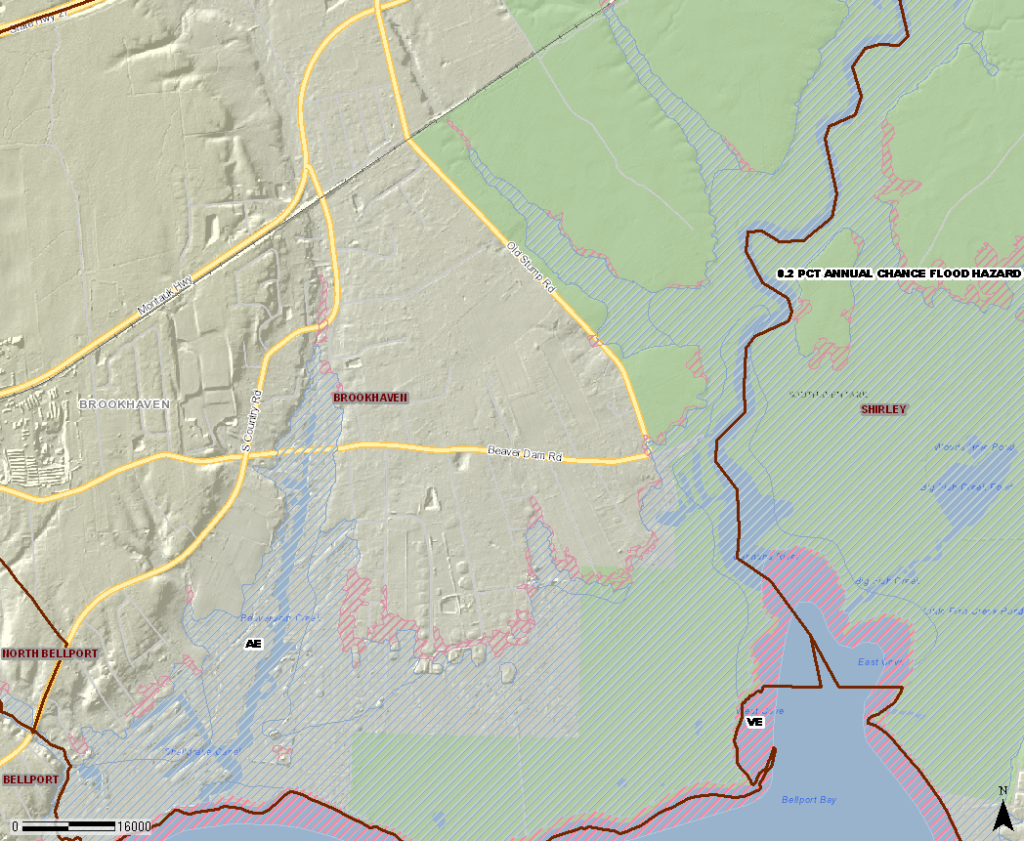
Definitions of FEMA Flood Zone Designations
Information on evacuation shelters and evacuation zones, as well as emergency planning and preparedness may be found at:
Suffolk County Department of Fire, Rescue and Emergency Services
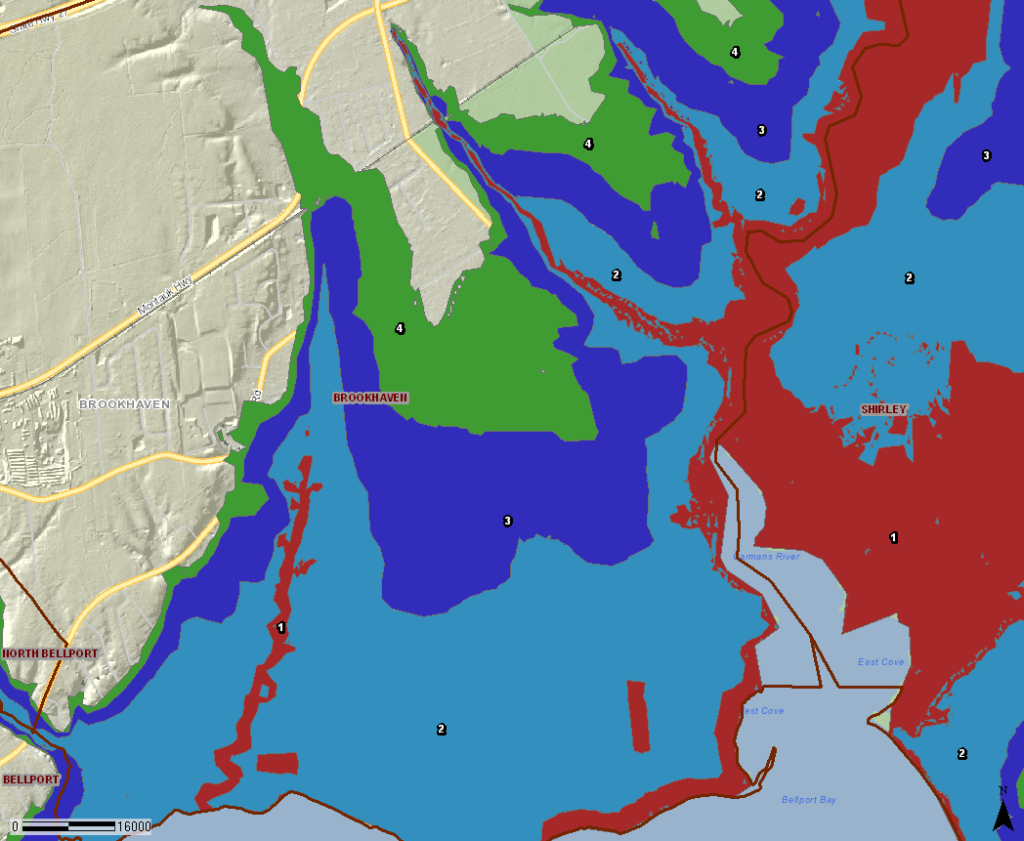
Sea, Lake, and Overland Surge from Hurricanes (SLOSH) Maps
The National Weather Service (NWS) conducts storm surge modeling. Hurricane storm surge modeling approaches the issue of flooding from a somewhat different perspective than that of the FEMA FIRMs. While the perspective of the FIRM is to produce a map that can be used by insurance actuaries to assess risk over the long term so that appropriate insurance rates can be developed, flood surge modeling is more focused on the specific effects of individual storms, without regard to their frequency or probability of their occurring.
The SLOSH zones are different from the FEMA flood zones. SLOSH stands for “Sea, Lake, and Overland Surge from Hurricanes.” It is a computerized model developed by the National Weather Service to estimate storm surge heights. It is used to predict potential flooding from storm surge rather than for predicting the specific area that will be flooded in a particular event. That is, it is used to determine what areas should be evacuated.
To get the SLOSH zones, the NWS computer model is run using worst-case scenarios to plan evacuation routes and determine what areas might potentially be in danger.
The National Weather Service does thousands of runs with hypothetical hurricanes and determines the “Maximum Envelope of Water” (MEOW) for a particular area for a particular hypothetical hurricane. The results are then combined for each category of hurricane traveling in the same direction, but going at different speeds and hitting the coast at different places. (The MEOW at each point, is the maximum of all the storm surges predicted for that point.)
Then they combine the data for all the different directions of travel. These are called MOMs, the Maximum of MEOWs. There is only one MOM per storm category. The MOM surge map is what you get when you select SLOSH to be plotted.
For Brookhaven Hamlet, the MOM for a Category 4 Hurricane indicates that most of the hamlet is flooded—going north up Old Stump road to Chapel avenue, along Beaver Dam creek/South Country road to north of Montauk highway, and of course along the Carman’s river to north of Montauk highway (although the calculation does not seem to take into account the influence of the Sunrise highway and South Haven dam). And surprisingly, the MOM goes right up to the front steps of the Old South Haven Church at the corner of South Country Road and Beaver Dam roads, even though it is seemingly on a not insubstantial hill, nearly twenty feet above sea level.
Suffolk County, New York, has, over the last few years, developed an important and useful tool that combines into one “source” a wide variety of land use information. This Graphical Information System (GIS) is essentially a computerized map of the county on which many overlays or layers of information have been applied. These include governmental jurisdictions, transportation, health and safety, infrastructure, elevations, tax map, environmental, and aerial photographs (both present day and historical). These layers may be included (or not) as needed to get a comprehensive picture of specific areas within the county. And one can zoom in and out to specific locations and levels of detail. Included as layers are the FIRMS and SLOSH zones for Brookhaven and South Haven Hamlets.
This map, and most of its layers, is available to the public. While it was a bit quirky when first introduced, my experience is that it is now quite stable and well worth the effort to get familiar with its features and navigation protocols. (A still somewhat quirky feature—if you want to save an image, click on the “world” icon, then select “print.”)
Old FEMA Flood Insurance Rate Maps (FIRMs)>
Federal Emergency Management Agency (FEMA) FIRMs have been revised and are now available as a “layer” on Suffolk County’s (NY) Graphic Information System (GIS) maps. These maps are available to the general public. Therefore I am no longer updating these maps on the BrookhavenSouthaven.org site. For historical and archival purposes, older versions of these maps are available by clicking the above link. However, should you want up-to-date FIRMs, visit the Suffolk County GIS.